Dashboard
Workspace administrators can access the dashboard to gain insights into the workspace and AI agents consumption. The module is split into three sections:
- Overview
- Usage
- Analytics
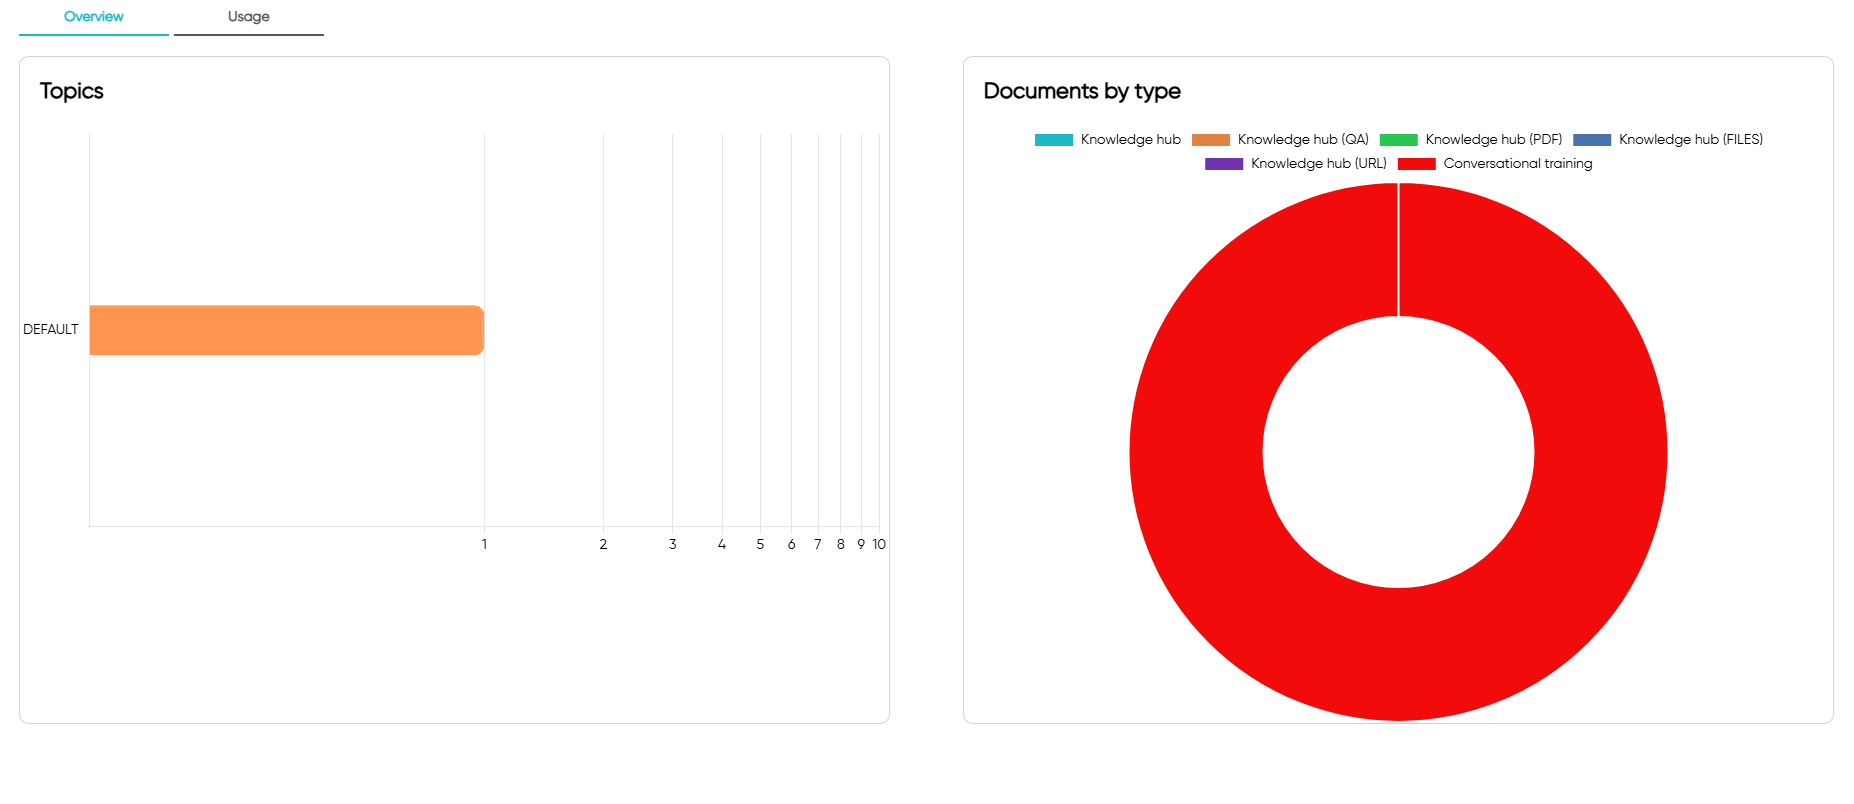
Overview
The overview section provides a summary of the workspace providing the following information:
In the header section you will see the following information:
- Agent model
Individual and Business subscriptions will display "Default" while the Enterprise subscription will display the name of the model selected.
In the body of the page you will see the following information:
- Topics -> Number of topics created
- Documents by type -> Number of documents created by type
- Intents -> Number of intents that agents can extract
- Keywords -> Number of keywords that agents can extract
Usage
The usage section provides a timeline month by month of the AI agents consumption grouped by type.
For enterprise subscriptions, ToothFairyAI will also display the fine-tuning consumption of any custom model created.
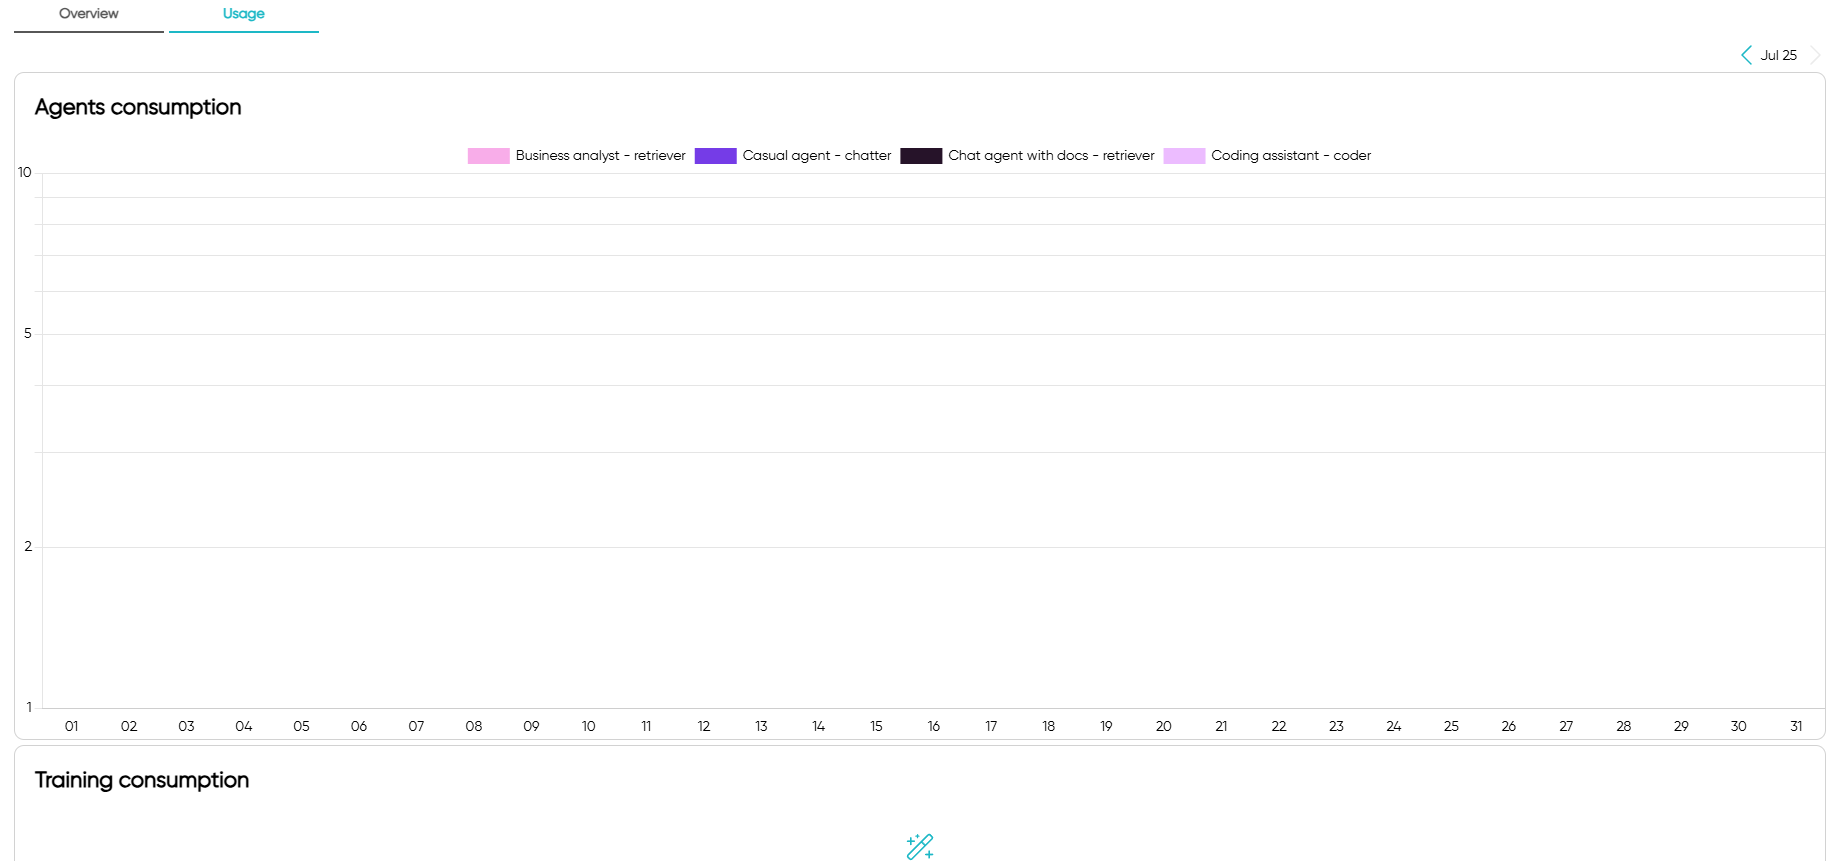
The usage section is updated every 30 minutes and it is not real-time.
Analytics
The analytics section provides AI-generated insights from chat interactions. You can filter analytics by agent and date range, and export data to CSV.
All analytics on this page are automatically generated by AI after each chat interaction.
Request Completion
Displays a donut chart showing the ratio of completed vs incomplete chat requests. This helps you understand how effectively your agents are resolving user queries.
- Completed - Requests where the agent successfully addressed the user's query
- Incomplete - Requests that were not fully resolved
Each conversation is assigned a completion score between 0.0 (not completed) and 1.0 (fully completed) to determine the overall status.
Customer Satisfaction
Shows a horizontal bar chart of customer satisfaction scores distributed across five rating bands:
- Very Low (0-2) - Poor satisfaction
- Low (2-4) - Below average satisfaction
- Medium (4-6) - Average satisfaction
- High (6-8) - Good satisfaction
- Very High (8-10) - Excellent satisfaction
The average satisfaction score is displayed in the header (e.g., "Avg: 7.4"). Each conversation receives a satisfaction score between 0.0 (very unsatisfied) and 1.0 (very satisfied) along with brief feedback.
PII Detection
Tracks personally identifiable information detected in chat conversations. The bar chart displays the count of detections by PII type, including:
email- Email addressesphone- Phone numbersname- Personal namesaddress- Physical addressesssn- Social security numberscredit_card- Credit card numbers
This helps ensure compliance and monitor sensitive data exposure in conversations. The system tracks both the types of PII detected and the total number of occurrences.
Toxicity Analysis
Monitors harmful or toxic content in chat interactions. The section displays:
- Average toxicity percentage - Overall toxicity level across analyzed chats (0% to 100%)
- Detection status - Shows "No toxicity detected" when conversations are clean, or displays harmful content detections when found
Toxicity is categorized into the following types:
profanity- Inappropriate languageharassment- Harassing behaviorhate_speech- Discriminatory contentthreat- Threatening language
Escalation Tracking
Identifies conversations that required or may require escalation to a human agent. The analytics track:
- Escalation required - Whether a conversation needed human intervention
- Escalation reason - Brief description of why escalation was necessary
This helps identify gaps in agent knowledge or complex issues that need human support.
Quality Scores
Displays a donut chart showing the distribution of conversation quality ratings:
- Excellent - Outstanding conversation quality with clear resolution
- Good - Solid conversation quality meeting expectations
- Fair - Adequate conversation quality with room for improvement
- Poor - Low conversation quality requiring attention
- Unrated - Conversations that have not yet been rated
Quality notes provide brief insights into what contributed to the quality score, helping identify areas for agent improvement.